Sankey Diagramm
Advertisement
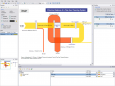
E!Sankey pro v.3.0
e!Sankey - a software tool to easily create Sankey diagrams. A Sankey diagram is a directional flow chart where the magnitude of the arrows is proportional to the quantity of flow. Sankey diagrams are a useful way of visualizing material flows,
Advertisement
Smartworks - Projektplanerleser
Freier Leser/Projektor fr Ms-Projekt und Smartworks projizieren Planer. Erlaubt Ihnen, Projektplne mit allen Verwahrern Ihres Projektes mit Mhelosigkeit zu teilen.Sehen Sie Diagramm Gantt, PERT-Diagramm, Netzdiagramme, Kostendiagramme und andere wichtige
Language Syntax Diagram Library v.1.0
This project aims at creating a Java application/library that is capable of generating a syntax diagramm of a (programming) language in the SVG graphics format.
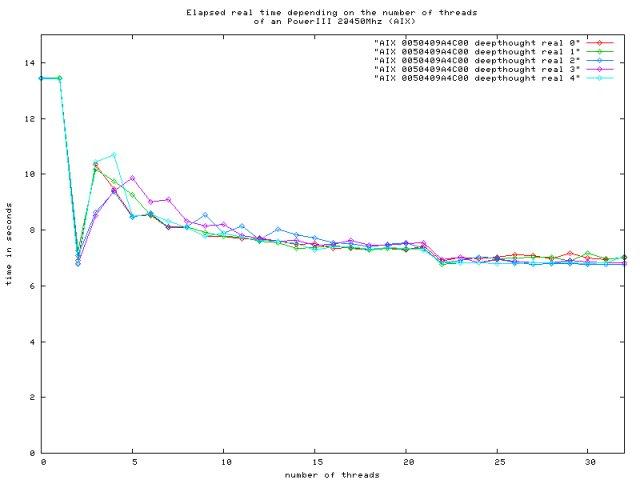
Threads Charts v.0.4.1
A program to draw (and save the results to files) a diagramm that shows the execution time of a programm, which does some floating point calculations, in dependency of the number of used threads.
PinchLeni v.3.0
PINCHLENI is a program for the energetic analysis of industrial processes. The Pinch Method evaluates the minimal heat input necessary for each process and how much heat can theoretically be internally recovered.
XLProject v.2.0
With XL Project it is possible to administrate your projects easily and efficiently. Do you also think that software like MS Project are too complicated and too expensive?
Gantt Control v.2010
The component Gantt Control enables software developers to visualize and schedule tasks, activities and events in their own software applications in a flexible way. Gantt Control is adaptable to different requirements and is applicable to most
Easy Funktion v.6.07-1
Easy Funktion is a function plotter to help you with your work. Easy Funktion is an easy-to-use function plotter that supports complex numbers as well as real numbers. Additional features are equation solving,
XmCHART v.3.3.3
xmCHART is a very powerful FileMaker Pro plug-in for creating graphs of numerical data in which all important types of charts such as bar, scatter, line, area, bubble, high-Low, candlestick, pie, radar, polar and Gantt charts are supported.
AnyChart JS Charts and Dashboards v.8.7.0
AnyChart is a flexible, cross-platform/browser, dependency-free JS chart library for adding interactive bar, area, pie, column, spline, scatter, line, gauge, treemap, funnel, sparkline, Mekko, Venn, other HTML5 charts/dashboards to any website/app.